Contents
Target outcome
Optically measured thicknesses of tissue testing samples.
Prerequisites
Infrastructure
For more details see Infrastructure/ExperimentationMechanics
Previous Protocols
For more details see Specifications/Specimens
For more details see Specifications/SpecimenPreparation
For more details see Specifications/ExperimentationAnatomicalImaging
For more details see Specifications/ExperimentationJointMechanics
Trials
Sample thickness measurement: Trial 1
Sample |
Optical measurement |
Using a constant-pressure LVDT probe |
Sample1 |
1.01 mm (0.056) |
0.59 mm (0.083) |
Sample2 |
0.83 mm (0.110) |
1.04 mm (0.199) |
Note For each sample 5 measurements were taken for both methods.
- Sample : mcl

Sample thickness measurement: Trial 2
Sample |
Optical measurement |
Using a constant-pressure LVDT probe |
Sample1 |
1.0937 mm (0.019) |
1.0764 mm (0.024) |
Note For each sample 5 measurements were taken for both methods.
- Sample: foam
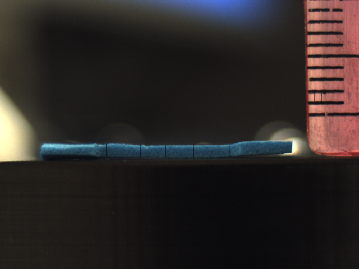
Sample thickness measurement: Trial 3
Sample |
Optical measurement |
Using a constant-pressure LVDT probe |
Foam |
2.102 (0.154) |
2.48 (0.074) |
Foam back |
2.66 (0.254) |
--- |
Cartilage |
2.175 (0.068) |
2.005 (0.016) |
Cartilage 90 |
2.106 (0.087) |
--- |
Tendon |
2.638 (0.327) |
2.183 (0.306) |
Tendon back |
2.574 (0.214) |
--- |
- Foam sample
- Cartilage cylindrical sample
- Tendon tensile sample
Optical thickness-measurement system design
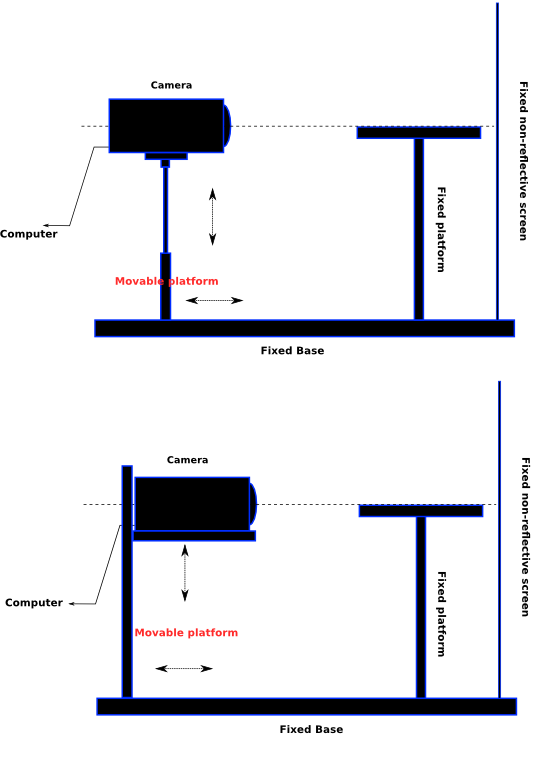
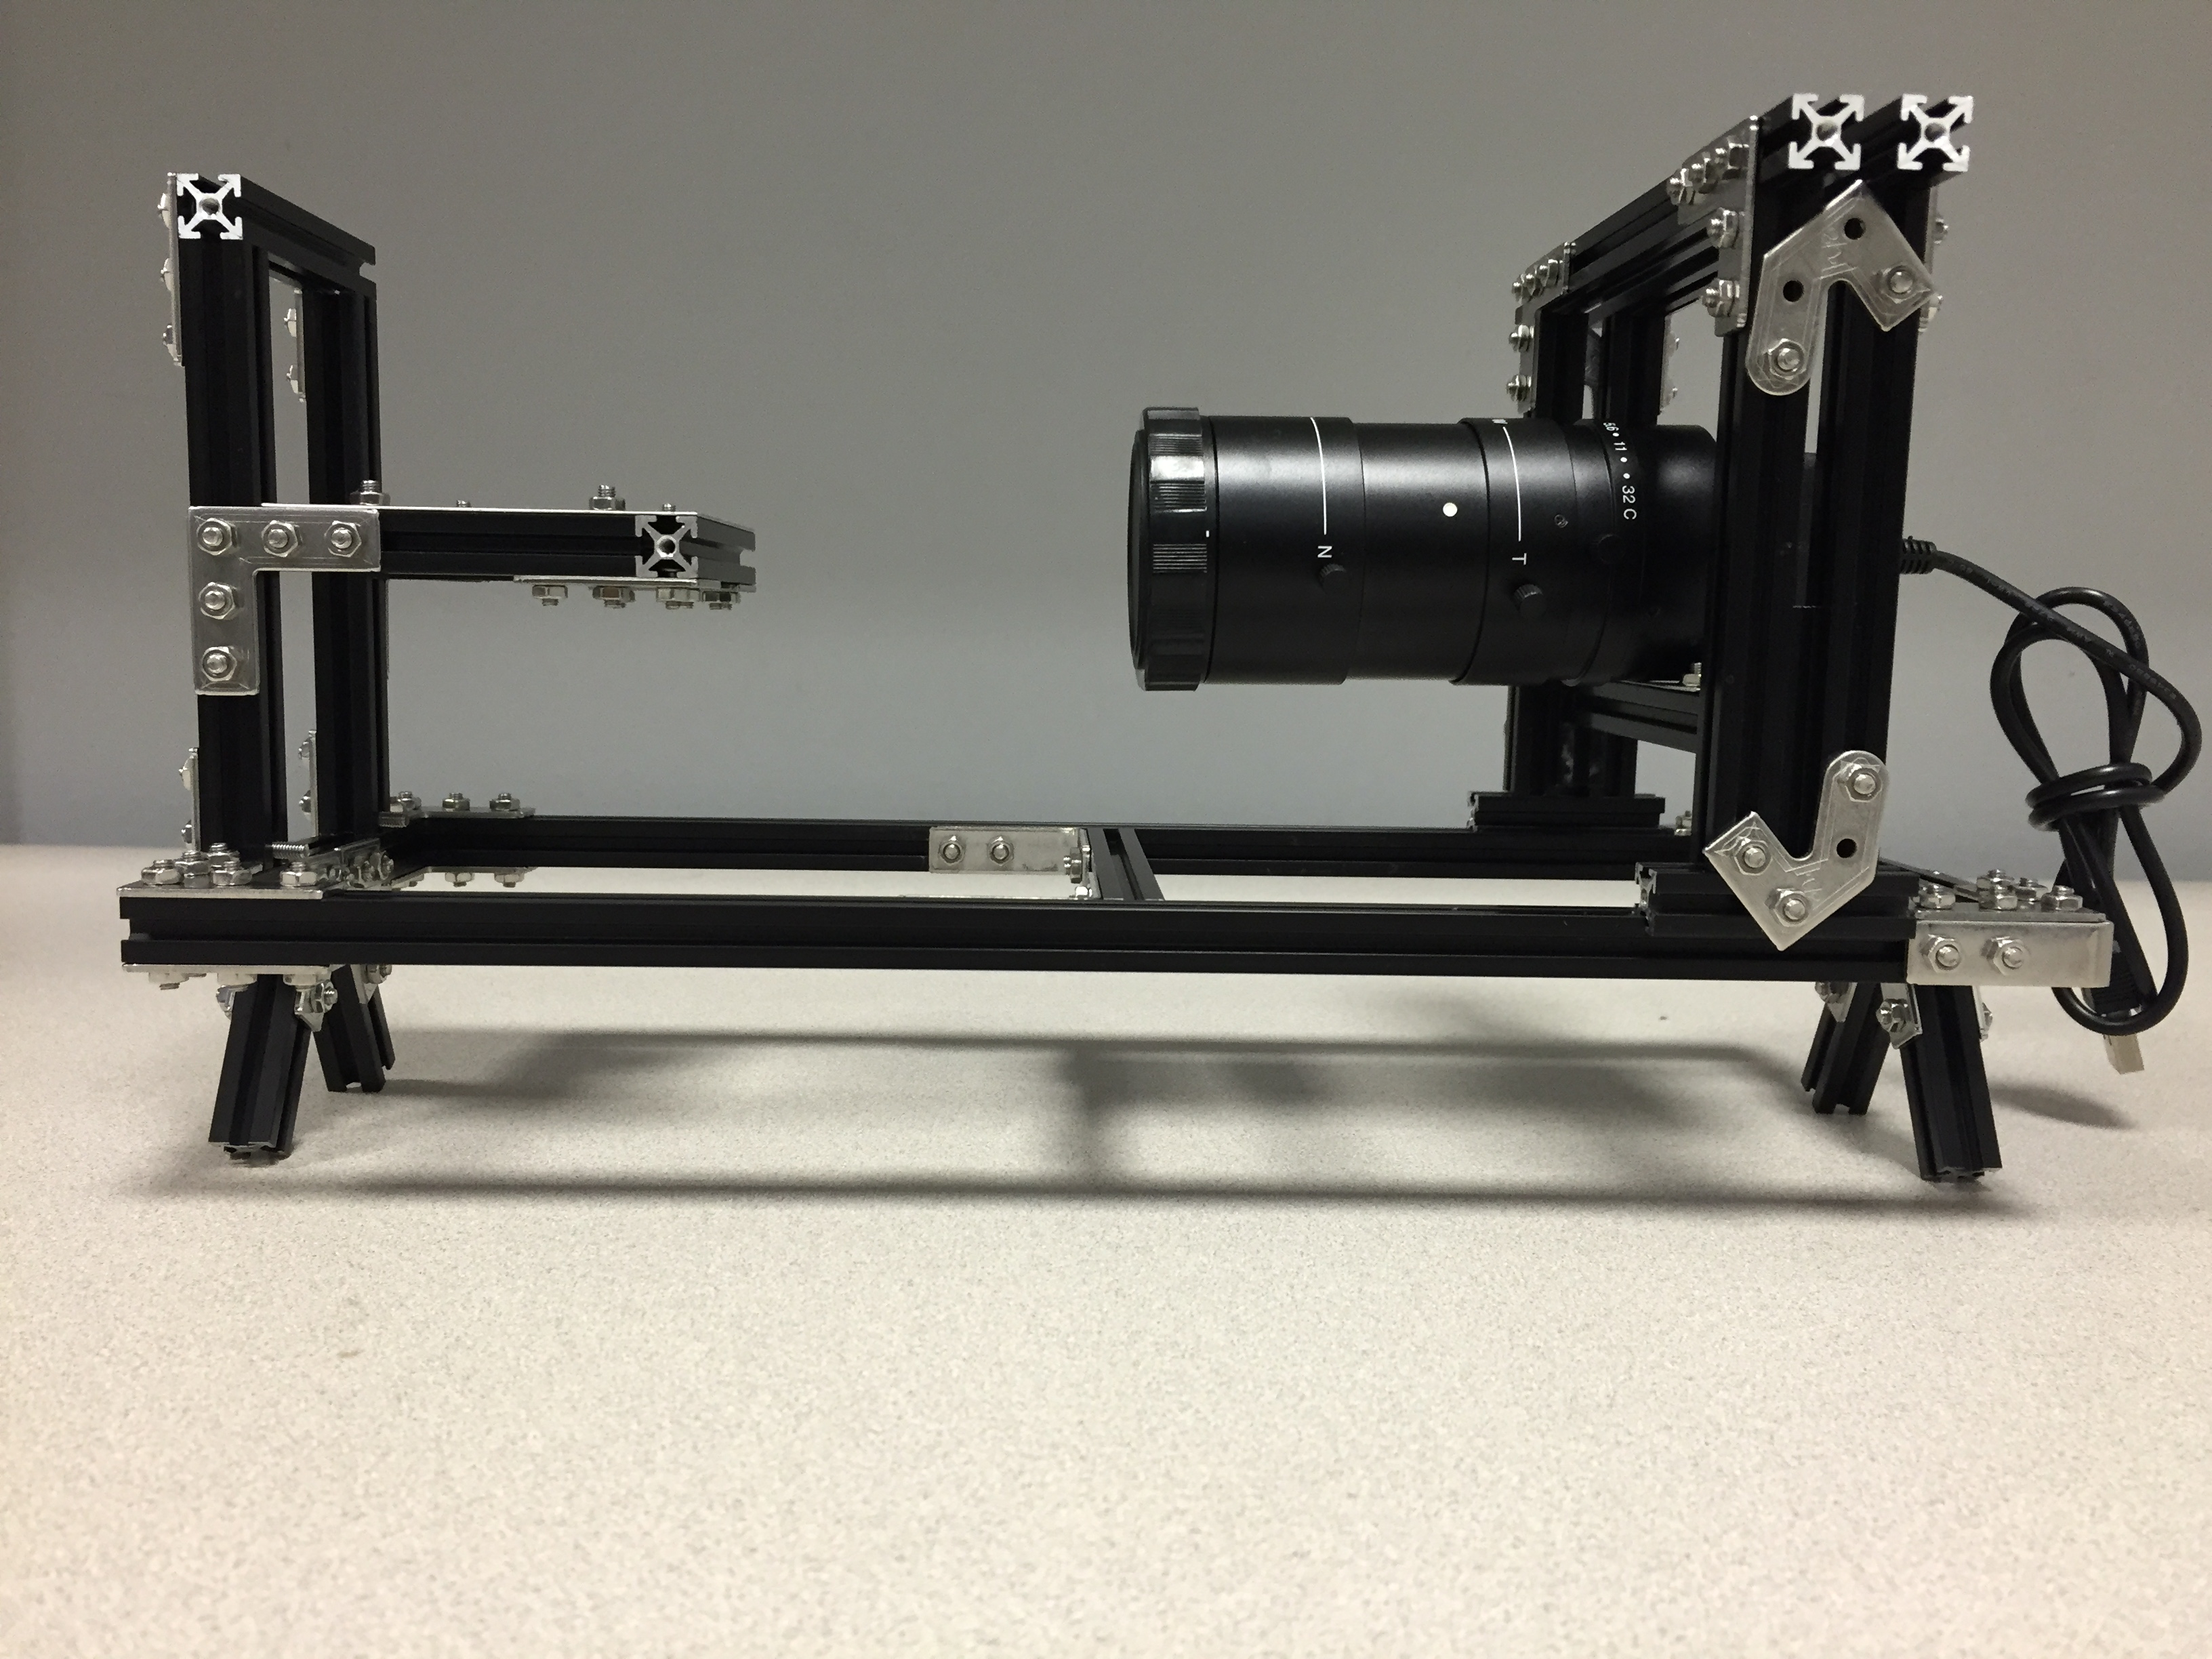
Optical Thickness Measurement System
Optical thickness measurement system (OTMS) set up
The frame is built using MakerBeam framing system.
- Lens: Fujifilm lens HF12.5HA-1B
- Camera: Firefly fmvu-13s2c-cs
- Ruler/gage pin: Stainless steel precision ruler
- Background: Blue
Note: OTMS design specifications will be added to Infrastructure wiki page.
Version 1 OTMS : Shown lens will be replaced with Fujifilm lens HF12.5HA-1B
OTMS image acquisition
- Place the sample close to the edge of the platform.
- Use flycapture software to acquire tissue+ ruler image.
- From the file menu capture video.
- Choose the folder where image is going to be saved, Frames=1, file type= .jpg.
Refer to Specifications/DataManagement for naming conventions.
Automated thickness measurement GUI
Files
The core of the optical thickness system consists of 3 files:
thickness.py contains the image processing code
utilities.py contains helper definitions used by thickness.py
main.py is the file that should be run, and defines the layout for the GUI
There is a fourth optional .exe file that can be used to automatically grab an image from any PointGrey camera currently connected to the computer, thus making the whole system standalone.
GUI Layout
The GUI in main.py is a wrapper around thickness.py to analyze individual image files. To use the GUI:
- Press the "Browse" button in the upper left
- Select the image file you want to analyse
- If you wish to see a preview of the image, press "Preview" un the upper right
- Type in the number of scans you wish to use in the analysis. (The more the better, usually).
- Type in the height of a single mark on the ruler to calibrate.
- Press the "Analyze!" button at the bottom
- On the image display that pops up, select the left and right bounds of the tissue sample
- Use a left mouse click to create a vertical red line at the left bound
- Use a right mouse click to create a vertical red line at the right bound
- When you are satisfied with the bounds you have chosen, close out of the popup to save them
- On the second popup, use a left click to draw a horizontal red line close to the bottom edge of the tissue
- This line does not have to be exactly at the bottom edge, but the closer the better
- Try to line it up so that it is halfway between the near and far edges of the table
- Close out of the popup to save the location of this line
- The third popup will have several small red vertical lines on top of the tissue. These are the thickness scans.
- Select any data points that you don't want to be included in the final list.
- Removed data points will be marked as black, included will be marked as red.
- Close this popup to save the data points.
- On the final popup, click to place a vertical red line on the left edge of the ruler.
- This line doesn't have to be exact, but the closer the better
- It is better to place it further to the left than to the right of the ruler edge.
- Close this popup to save the ruler location.
- There will be a lot of output on the console; the final number should be the thickness in mm. This number will also be displayed under the "Analyze!" button on the GUI window.
Methodology
Once the user specifies the left and right bounds of the tissue, the script partitions that into the correct number of vertical strips and performs a thickness scan on each script to get the height of the tissue at that x-coordinate. Each scan consists of first considering the region from the top of the image to the user-marked tissue bottom and calculated the standard deviation in color for both the top and bottom half. Similar to a binary search, the script then recurses on the half with a higher standard deviation, thus locating the top edge of the tissue at the relevant x-coordinate.
The pixel heights from each scan are averaged, then a ratio is computed to convert pixels into millimeters. To compute this ratio, the ruler (as defined by the user) is scanned down 350 pixels and the number of marks crossed are counted. These two values are divided to procure a conversion of marks/px. The conversion is then multiplied by the height (in px) and then by the mark height (in mm/mark) to yield the final result in mm.
Manual thickness measurement GUI
- This GUI was developed using python 3.5.1 to manually select the thickness values from a given tissue sample image taken with OTMS set up.
- Python script: manual-thickness-measurement.py (version 01 as of 02-08-16)
- The GUI allows browsing and selecting an image file, manually select calibration measure on the ruler (has to be included in image taken with OTMS set up), pick multiple measurements on the sample, calculate average thickness and standard deviation and save the output in an xml file as well as save the image with the measures.
- Usage instructions:
- Select and open image file using the browse button.
- The image opens in a figure container which provides pixel tracking as the curser is moved around on the image.
- Pick distance on the ruler for calibration (larger distance in preferable). Hit calibrate. Output number of pixels are shown on the GUI.
- Note: matplotlib figure window where image is displayed allows the user to zoom in on the region of interest for picking the boundaries of samples more effectively.
- To pick measurements on the sample, hit pick button. This allows two clicks to select a thickness value on the image.
- The script also plots the measurements on the image.
- To confirm the measurement click ok button.
- This will display the measurement in mm.
- Once sufficient number of measurements are selected, click compute. This will output average and standard deviation on the GUI.
- The save button saves the calibration values, measurements, average and standard deviation in an xml file. It also saves the image with all the plotted measurements to a png file.
- Both the xml and png files have the same names as the image file. Here user needs to make sure the image file name follows data labeling convention.
- Current limitations and modifications in progress:
- Replace the ok button with right click to accept measurement.
- Currently there is no provision to deselect a measurement. However, after picking a measurement if ok button is not clicked, the script does not include that value in calculation.
- The user needs to manually maintain x coordinate of the pixel while picking the measurement.
- Currently maximum 10 measurements can be taken, script will be modified to interactively add more measurements as needed.
OTMS trials
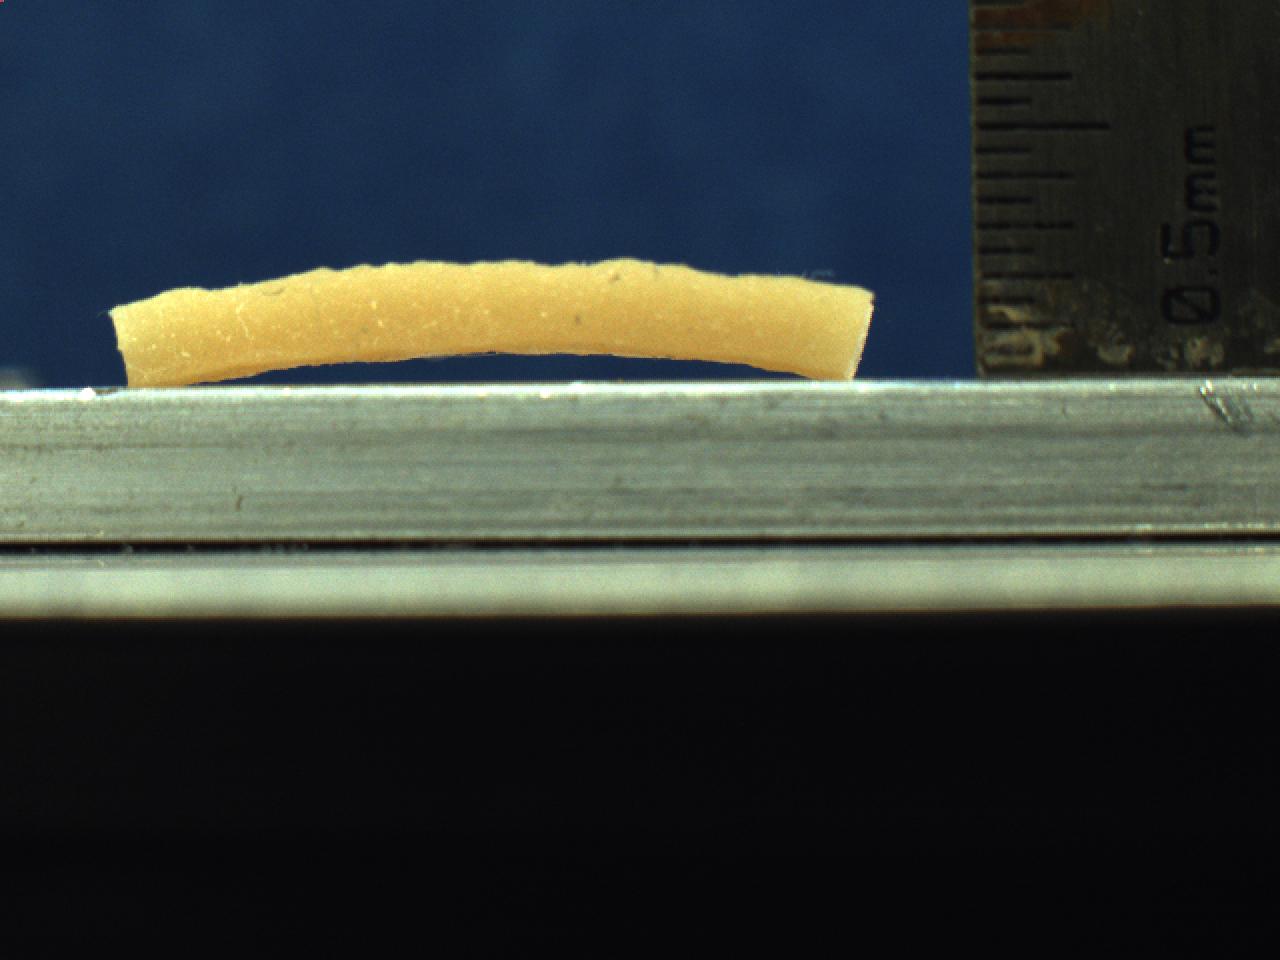
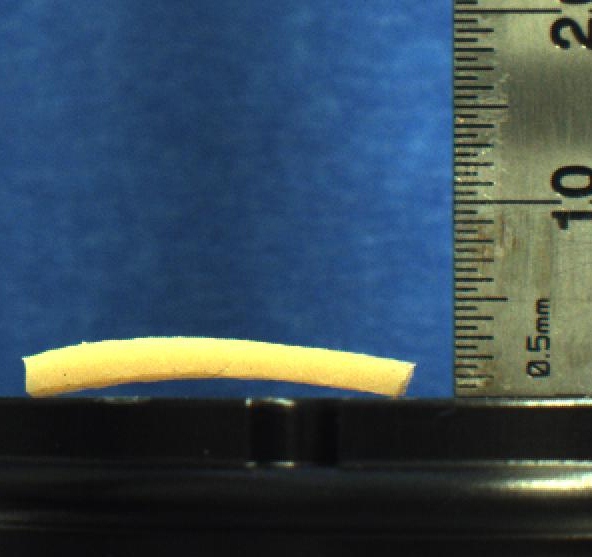
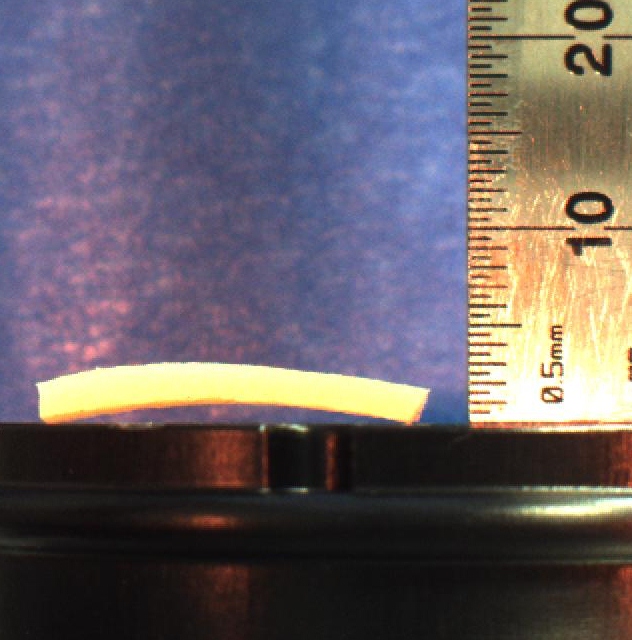
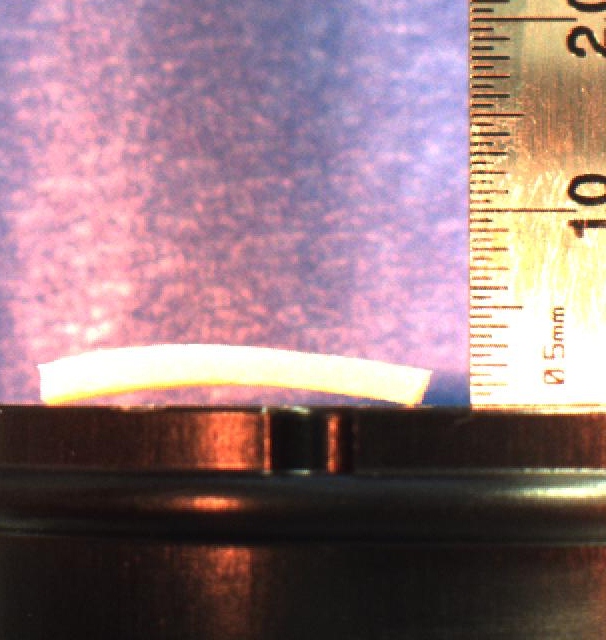
OTMS performance in ambient light
1. Image taken with the OTMS system with ambient light. Front edges of the sample and platform are aligned with the ruler. Small aperture.
2. Image taken with OTMS system with ambient light. Ruler is aligned with the middle of the sample.
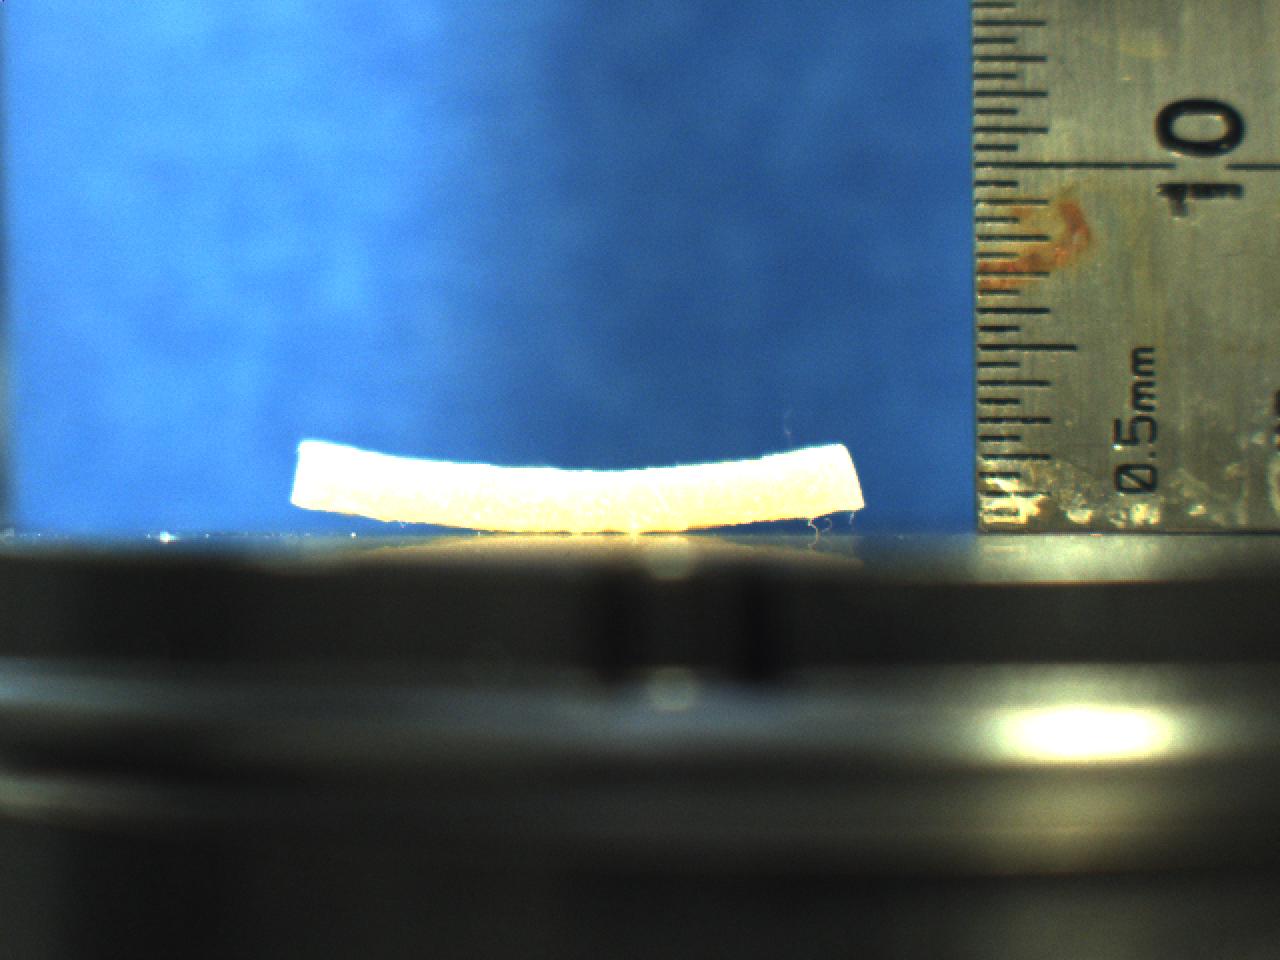
OTMS performance with focused light source
Images taken with no light, low light and medium light.
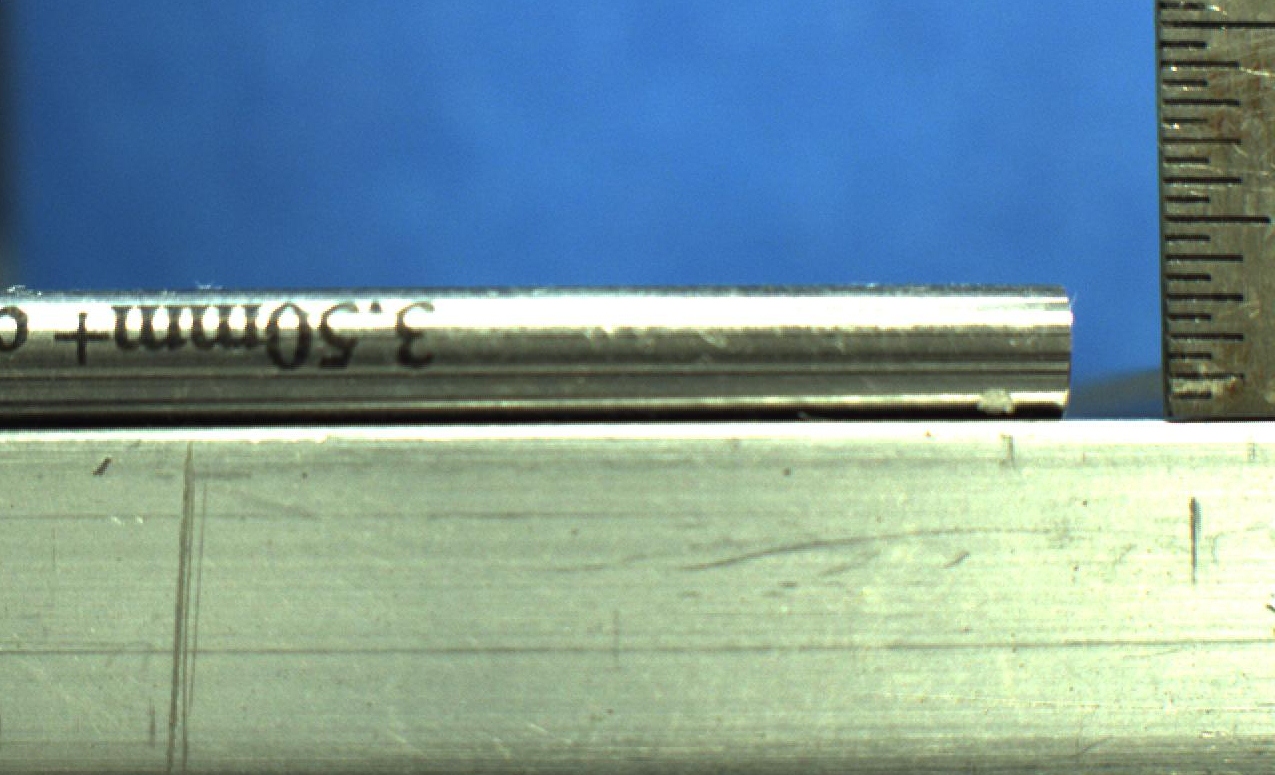
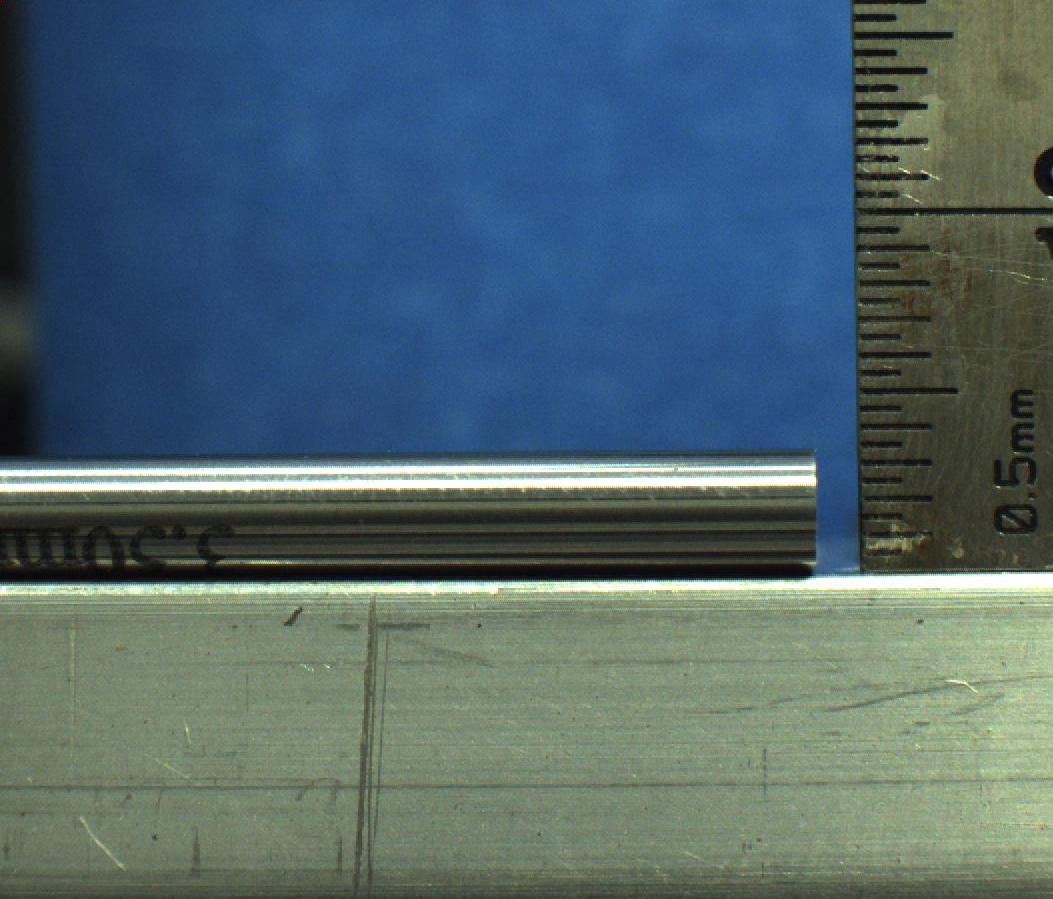
OTMS accuracy assessment with gauge of known diameter
Images of 3.5 mm diameter gauge pin taken with,
- ruler aligned with the front edge of the platform and front edge of the pin and,
- 3.596,3.567,3.567,3.623, 3.596 == 3.5898 mm (0.023552)
- ruler aligned with the diameter of the pin with the pin placed such that the front edge is aligned with the platform's front edge
- 3.5127,3.4614,3.5127,3.4614,3.5127 == 3.49218 (0.028098)
Notes
1. Ruler and sample need to as close to the front edge of the platform as possible. Preferably, flush with the front edge to avoid distortions of the front edge of the platform when camera focused on the ruler/sample.
References
Comparison of methods used to measure the thickness of soft tissues and their influence on the evaluation of tensile stress. O'Leary SA, Doyle BJ, McGloughlin TM. J Biomech. 2013 Jul 26;46(11):1955-60. http://www.ncbi.nlm.nih.gov/pubmed/23800758
